Enterprise Data User Journey
As of 2023, Capital One manages over 600 petabytes of stored data. The data is produced and consumed by:
Software engineers, developers, data scientists, analysts, ML modelers, etc;
All interacting with various platforms and tools to utilize the data.
This collection of users and their respective actions make up the data lifecycle – from the creation and collection of new data to the eventual archival or deletion of data
Role
Team
- 2 Service Designer Leaders
- 1 Director
TimeLine
skills
Impact
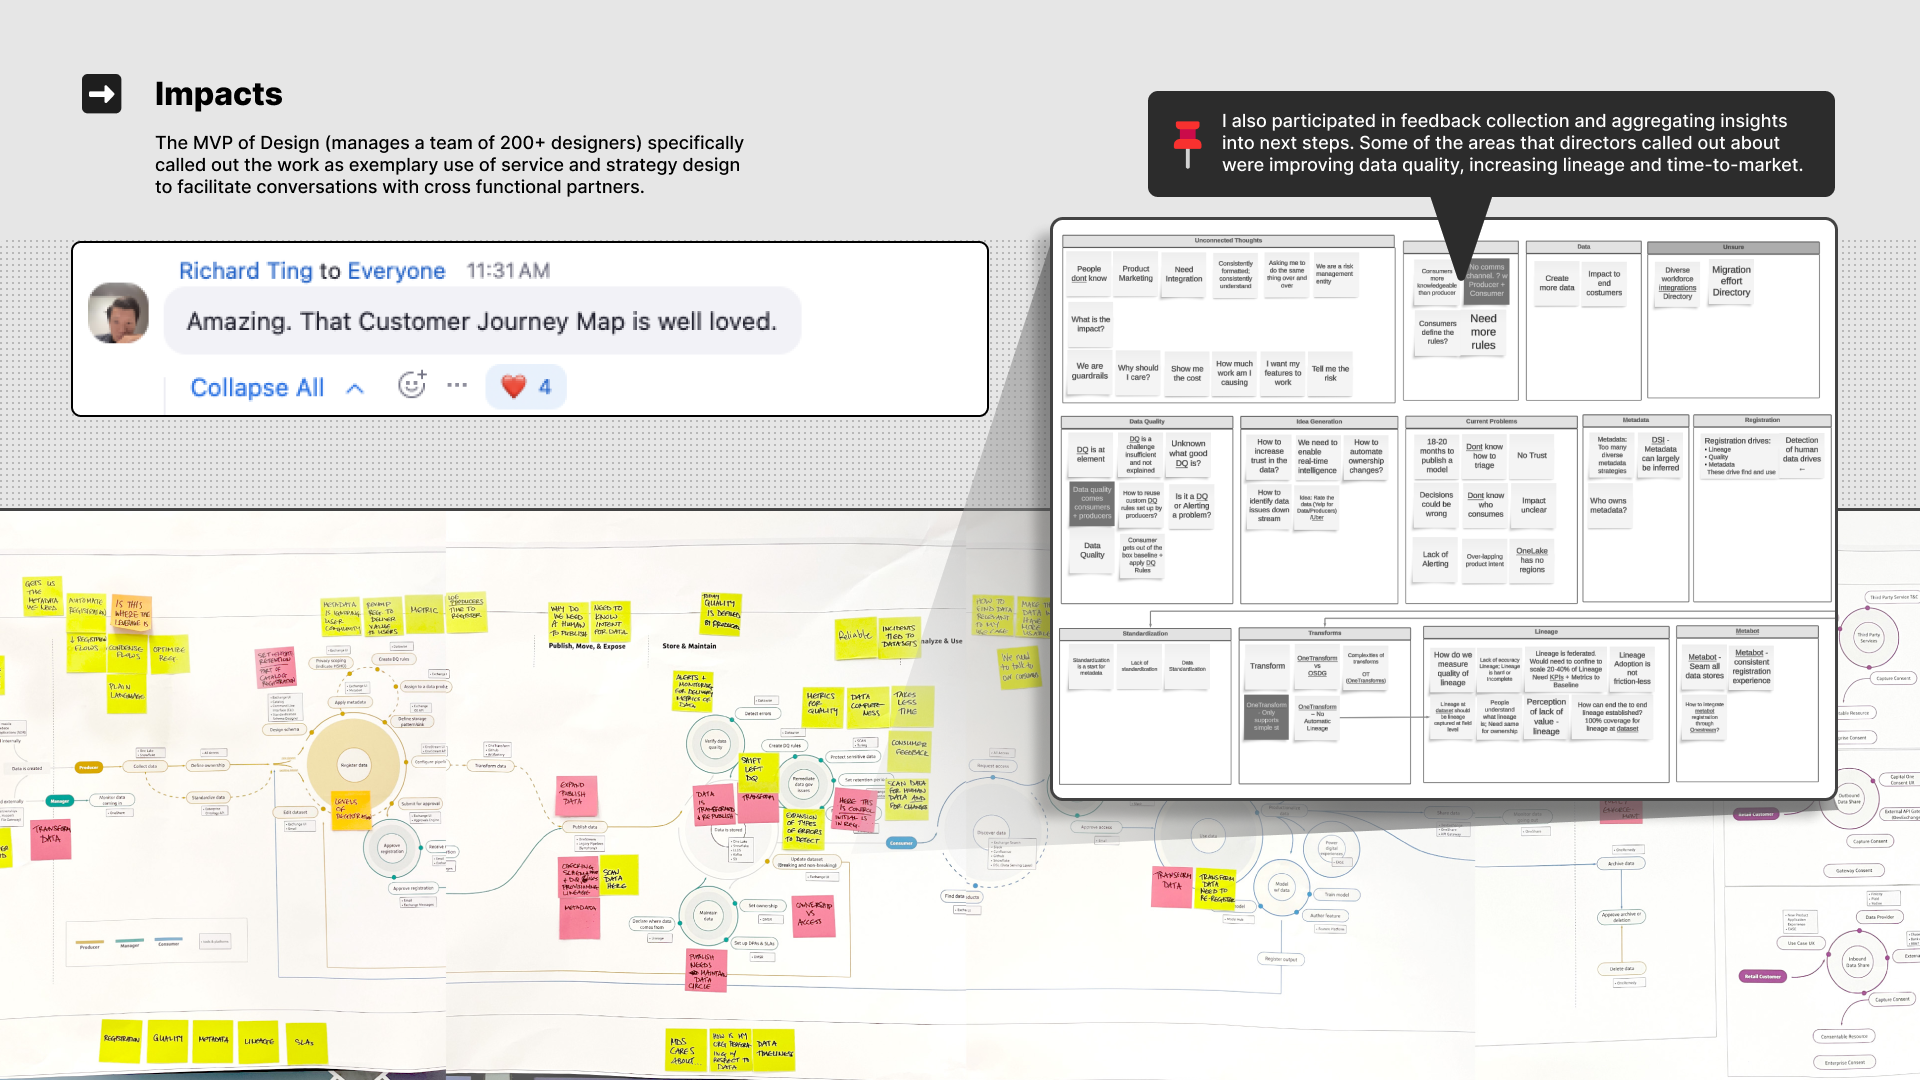
- Recommendations from mapping were leveraged in four 2024 annual planning sessions at the Director/VP + level and led to initiative prioritization and team alignment across the Enterprise line of business (600+ individuals)
- Work was recognized by MVP of design as exemplary use of service and strategy design to align the organization
Discover
Objective: There is no visual that captures the end-to-end data system in a clear and actionable way. This leads to platform teams not understanding the user experience, creating duplicate solutions and disregarding downstream impacts
Contribution: Collected research, interviewed SME, synthesized findings across data areas. Collaborated on strategy, iterated on journey map design and co-presented to SLT
Result: Provided SLT with scalable visualization and boundary object that enabled baseline understanding, discussion on prioritization and alignment
.png)

Define
Objective: Collect existing resources and define a problem statement and design perspective. Identify the major steps, platforms and tooling through interviews with SME
Contribution: Collaborated on research brief, identified and interviewed key SME platform owners, collected notes and transcribed insights into low fi mapping
Result: Collected 10+ past product and design artifacts to develop participant activity. Conducted 8 interviews and noted 280+ comments

.png)
Design
Objective: Refine the low fi mapping based on feedback and design expertise
Contribution: Created numerous design iterations based on platform owner, manager feedback and judgement. Worked with content team to refine phrasing
Result: Developed a mapping with refined content, consistent design language and unified end-to-end experience

Synthesize
Objective: Provide SLT with scalable and customizable boundary object visualization that enables discussion and planning
Contribution: Collaborated on final visual and presented end-to-end user journey in various internal and SLT share outs
Result: Developed unifying template design. Final mapping showcases 3 users, their actions, the major tools and platforms used Map template link

.png)
Deliver
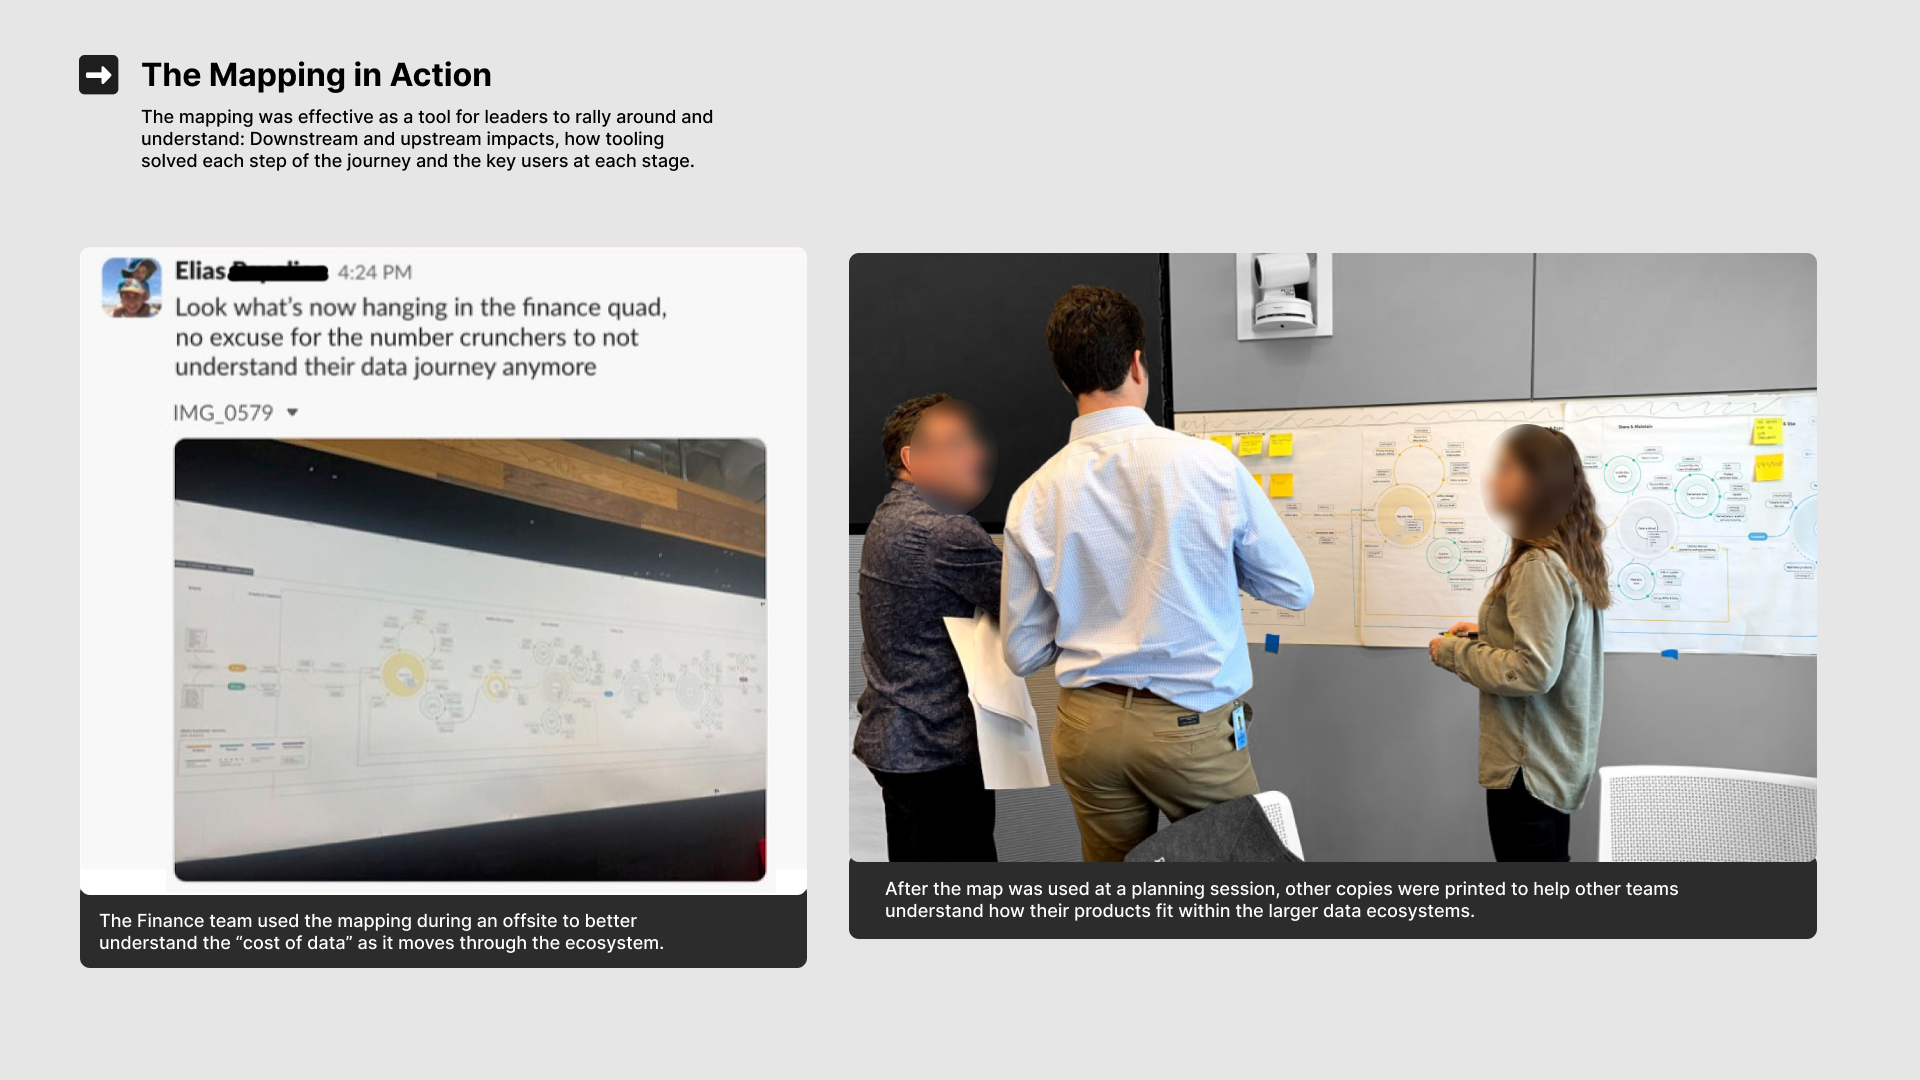
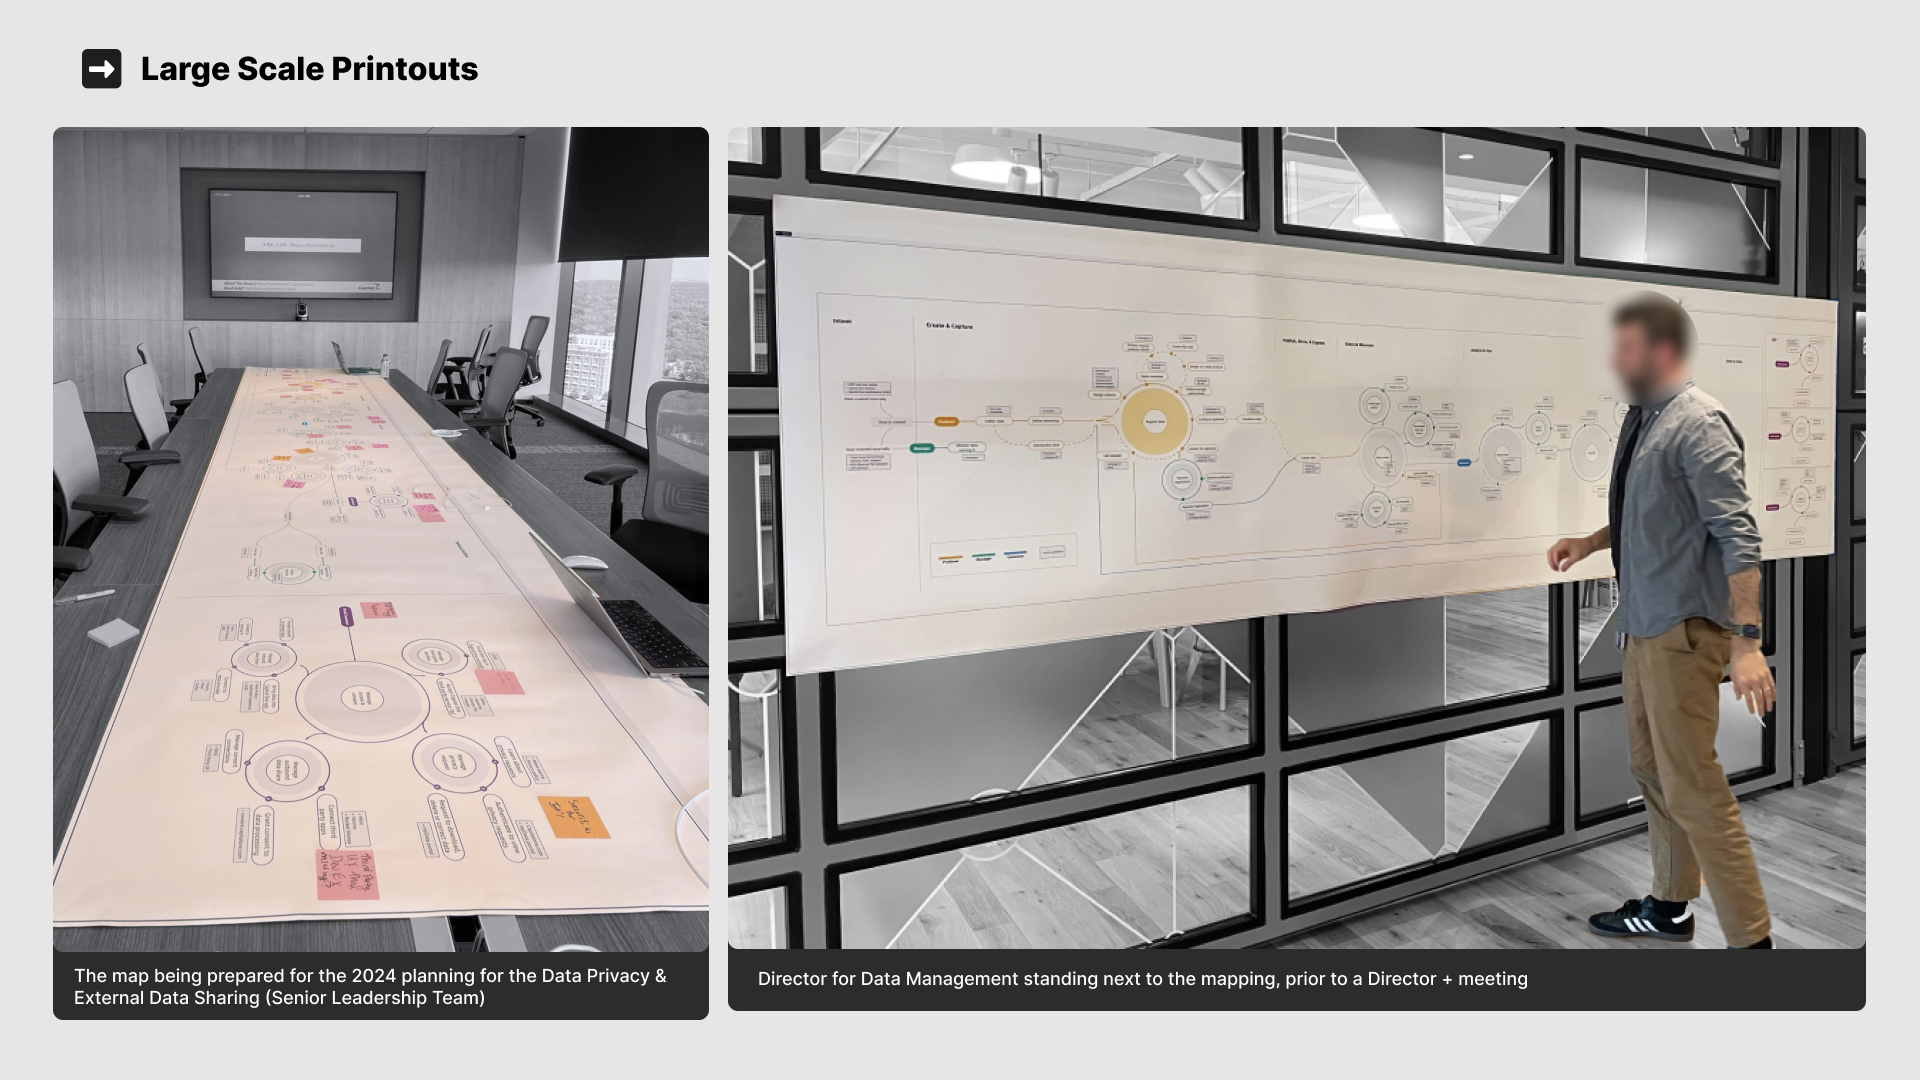
Map was printed out (16ft at scale) and used for various SLT planning sessions and internally for planning
- 2024 Planning for Data Privacy & EDS (SLT)
- 2024 Planning for Data Management (Director+)
- Finance team offsite (data cost analysis)
- 2023 eData Project Mapping
Map influenced roadmaps and team alignment
.svg)